Dashboards
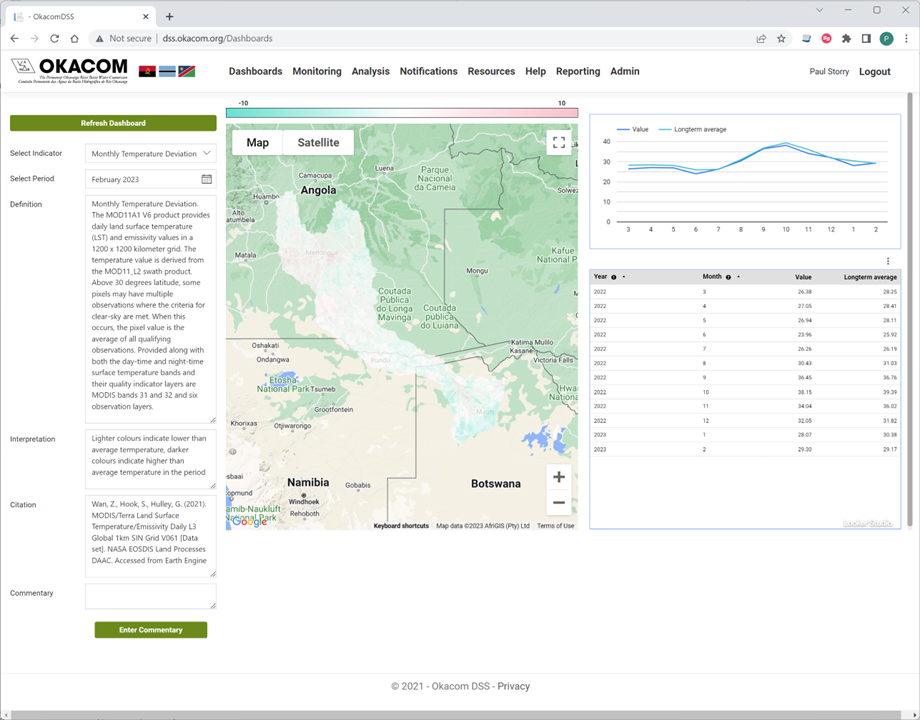
The Dashboards section is intended to provide snapshots of current information and is accessible without logging into the system. The screen is divided into three sections. On the left-hand side the user can select the dashboard and time period, in the middle is a map relevant to the dashboard selected, and on the right the data is show in graphical and tabular formats. In general, the graphs are interactive.
|
Dashboards Names |
Dashboards Explanation |
|
Select Indicator |
Various types of indicators are made available. Some are processed images from Google Earth Engine and some are composed of data from other sections of the DSS |
|
Select Period |
Most dashboards are time based, and a month can be selected here |
|
Definition |
Not editable text which describes the dashboard and its use |
|
Interpretation |
Non editable text provided as an aid to interpretation of the data |
|
Citation |
The source of the data (also non editable) |
|
Commentary |
Commentary provided by the system administrator or others with the correct role. This allows the user to provide some additional commentary or interpretation which will then be pulled through to the State of the Basin reports for the particular period |
Created with the Personal Edition of HelpNDoc: Easily create HTML Help documents