Parameter Columns
Parameters can be added to the chart in this tab. Parameters can be selected from the columns in the underlying view by clicking the Add Parameter Columns button. The screenshot below indicates how the parameters relate to display of the graph in the Monitoring and Analysis sections.
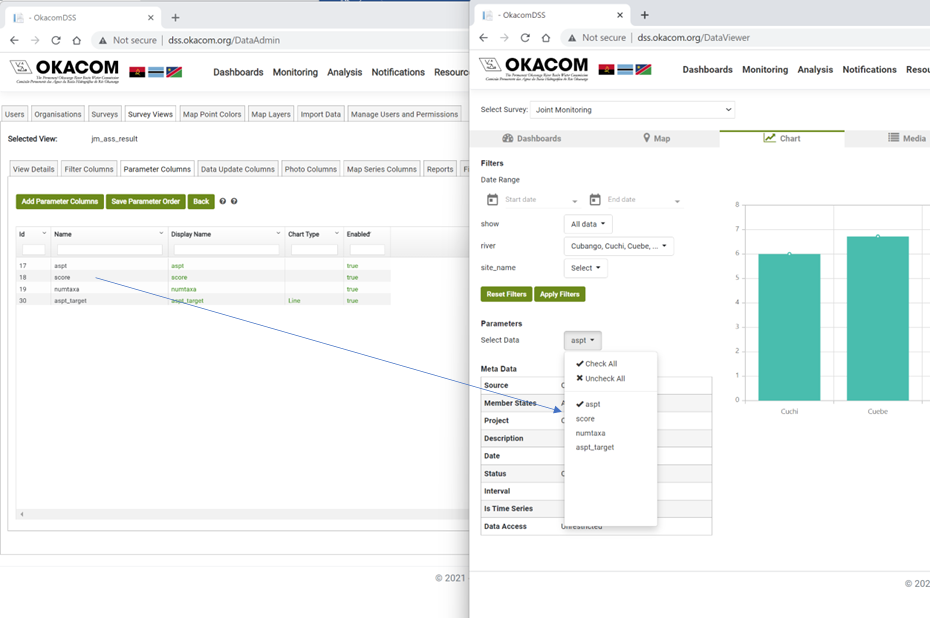
The grid is also editable to modify some of the properties of the chart.
|
Parameter Column Names |
Parameter Column Explanation |
|
Display name |
Enter a more descriptive name for the parameter if the column name is not intuitive |
|
Chart Type |
This allows for combination charts of bars and lines. Select this from a drop down list |
|
Enabled |
Setting this to true will make the parameter visible on the Charts tab |
Created with the Personal Edition of HelpNDoc: Create help files for the Qt Help Framework