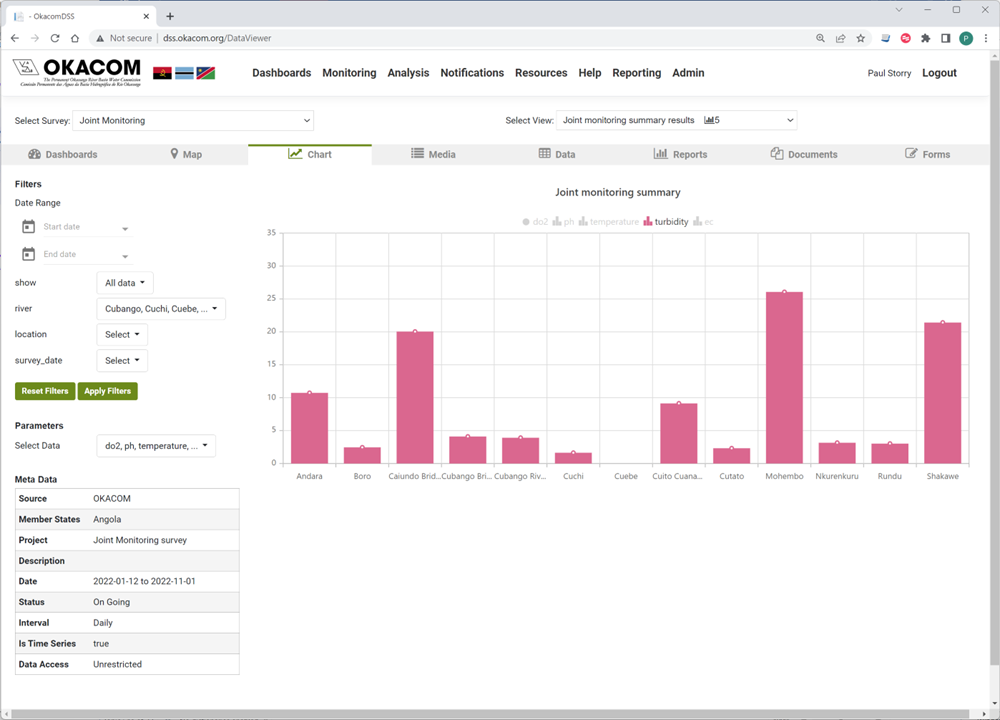
Chart
The Chart tab displays the underlying data in a chart format set up in the administration section.
|
Monitoring: Chart Names |
Monitoring: Chart Explanation |
|
Filters |
Filters are as in the Map tab |
|
Parameters |
The user can chose to display one or more parameters in the graph |
Created with the Personal Edition of HelpNDoc: Produce online help for Qt applications